
“there is no such thing as ‘what works’ in education. It’s good to employ a range of pedagogical approaches to meet the needs of children in their different contexts”
“When it’s interesting enough, chalk and talk does work.”
“There is a #bestway!!! The best way is #nobestwayoverall😀 By admitting that we know there is no best way to teach and that students learn in many ways, we empower ourselves to create better opportunities to engage our students in learning.”
“I’m always deeply suspicious of initiatives which make use of “research which shows how students learn best”? We are all individuals and all have our own preferred learning styles – one-size most definitely doesn’t fit all? And don’t start me on “group work””
“I think it can be useful if done well, and harmful if done poorly.”
“If you say my students don’t like collaborative activities because I’m doing it incorrectly, shouldn’t it also apply that your students don’t like lecture because you’re doing it incorrectly?”
“What works is the wrong question. Everything works somewhere; nothing works everywhere. Under what conditions does it work?”
This is a blog about policy and interventions. It’s about why some interventions work and others don’t. It’s something I’ve been thinking about a lot recently and don’t pretend to offer any actual original thought. Instead of adding content to the debate, I want to try and address its form, to look at the way we talk about interventions and perhaps help give that discussion a useful analytical tool to try and address the implementation of interventions.
I’m going to start with some chemistry. Don’t worry, I’ll keep it pretty simple and I think it’s a useful place to start. In the box below, you can see an atom:

This atom isn’t static. It’s moving around, bouncing off the walls and stuff.

It’s not particularly interesting when it’s by itself. It just bounces around. So let’s chuck another atom in:

Now I have two atoms bouncing around happily.
Eventually, those two atoms will bump into each other – bump!

If they bump into each other really slowly, they just bounce off each other again.
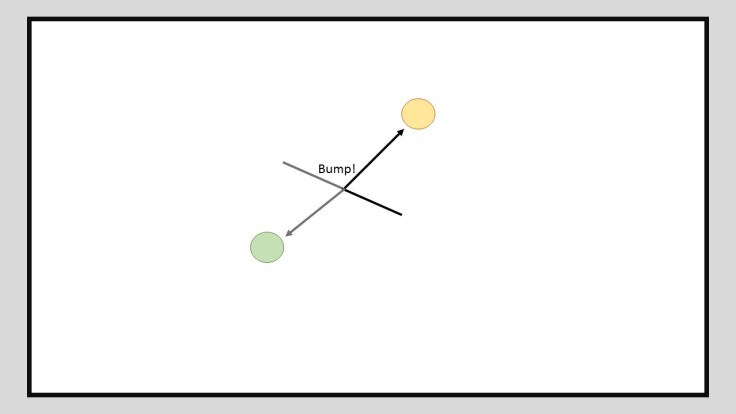
If they bump into each other really fast though, something special can happen:

They’ve bonded together! Two atoms, that were separate, are now joined together by a chemical bond. That’s really cool. But whether they bond depends on if they bump together hard enough, which depends on how quickly they are moving.
Their speed is important then. Let’s say we measured their speed in numbers from 1-9, with 1 being really slow and 9 being really fast. Let’s pop some atoms into our box, and we’ll show how quickly they are going:

Now let’s imagine I have 100 atoms in the box. I’m not going to draw them all out, but it’s not so hard to keep a picture in our mind’s eye of what that would look like. 100 atoms, merrily bouncing around, each with a little number telling us how fast it’s going.
Now, and this is the slightly complicated part, not all speeds are equally likely. So if I had say 100 atoms, I wouldn’t expect 10 to be a 1, and 10 to be a 2 and 10 to be a 3 etc. I might expect there to be a couple of 1’s, a few 2’s a bit more 3’s, a bit more 4’s, quite a lot of 5’s and 6’s and then decreasing again like before:

When I plug those numbers into Excel, I get a neat graph that looks a bit like this:

Lots of atoms in the middle, fewer out to the edges.
Now do you remember that we said that atoms need to bump quickly or they don’t react? Let’s say that only atoms with a speed of 8 or above can bump quickly enough to bond together. Looking back at our table, that means there are actually only eight atoms which can bond at this point:

On the graph, that means that only the yellow ones here can bond:

So far so good, but the thing is, there are only 100 atoms in that box. That might sound like a lot, but in reality, atoms are so tiny, that absolutely zillions of them would still fit in a pretty tiny box:

Even the box above is an underestimate. I could fit something like 200000000000000000000000 atoms in a matchbox, and if I just sat duplicating atoms in powerpoint I would probably die of old age before I finished that number.
It gets a bit more complicated too. Because those atoms aren’t just a 1 or a 2 or a 3. They could also be a 1.7. Or an 8.2. Or a 6.3450686 or any value really. Which makes things a bit more messy, and drawing a table just wouldn’t be possible. Instead what we do is some really clever maths stuff and work it out with a neat formula, then chuck that at a graph. It ends up looking a bit like this:

It looks a bit weird, but it’s pretty simple. On the bottom you have the velocity – that’s how quickly the atoms are going – and along the side you have the number of atoms that are going that quickly. So you can see that most of the atoms are in the middle, going at a kind of “middle” speed. There are ones which are going really slowly, and other ones which are going really fast, but there aren’t that many of them.
Remember: not all of them are moving fast enough to bond together. What chemists do is they put a line on the graph that looks a bit like this:

Everything to the right of that line is moving fast enough to bond, everything to the left is not.
Congratulations, you can now do chemistry A-Level.*
I’ve not gone mad, I promise. It’s relevant. The above is a variation of something called a “normal distribution.” Roughly, this means that when you take a lot of things – be they atoms or people – there tends to be a lot of things in the middle, and fewer and fewer out towards the edges. Height is another good example. The overwhelming majority of people fall within a relatively narrow range of heights. Sure, there are some people who are extraordinarily tall and some people who are extraordinarily little, but there are very few of them.
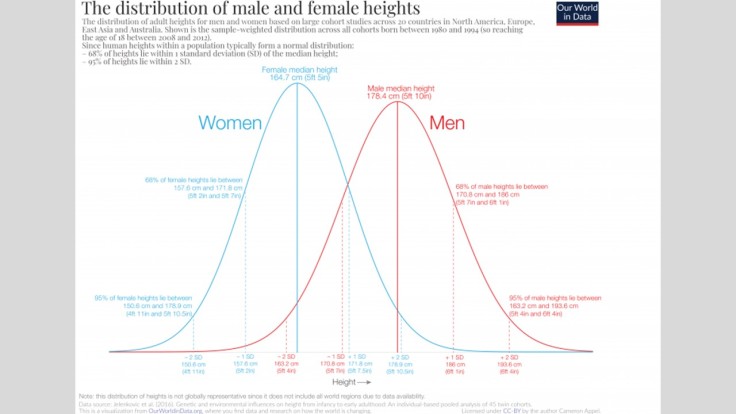
Now if we had some kind of activity that required people to be super tall (like professional basketball) then we would have a small number of people to choose from. The average male NBA player is 6ft 7in. That’s really tall, and it will disqualify a lot of people from being eligible to play professional basketball.
Why does all this matter? It matters because many human characteristics work like this. Things like height, weight, heart rate – all of those follow a normal distribution, with most people being in the middle and some people out at the edges.

I’m going to get a bit controversial now. Let’s say instead of counting everybody in the world, we took teachers. And instead of looking at their height or weight or heart rate we looked at their “ability to improve student learning.” I imagine we would also get a normal distribution. The overwhelming majority of teachers would be close together in terms of their ability to improve student learning. Some would be way out there on the right – the super teachers who are just brilliant – and some, sadly, would be way out there on the left – the teachers who don’t quite seem to be hitting the right notes.

Now, let’s take a simple educational intervention like implementing retrieval practice. By now scientists are pretty sure that in lab based studies retrieval practice improves student learning. But does it work in class? Does it work when teachers are implementing it?
Sometimes yes, sometimes no. Teachers really can – and probably do – mess up something like retrieval practice. Giving students bad feedback, setting questions that are too hard, not giving them tools to practice at home – all of these are ways to mess up retrieval practice. All of these could, and probably do, happen. So let’s say I take 10,000 teachers and give them maybe an hour’s training on retrieval practice. How many of them will go in and get it right, and how many will screw it up?
If retrieval practice is easy to implement, then only a few teachers will screw it up. Every teacher to the right of the line below will get it right:

That’s most teachers – by a long way. Of course there will be some who get it wrong. It’s inevitable. But most of them will get it right.
However, if retrieval practice is hard to implement then the line will be over there:

Which actually means that most people will be getting it wrong. Sure, the super teachers will still be smashing it out the park, but nobody else will. Retrieval practice is just one example of a huge number of things teachers can do in the classroom, but it is generalisable – how many teachers will get this right easily, and how many will not?
So the question here isn’t “does this work?” or even “where does this work?” but “how likely is it to work?” If most teachers, most of the time, won’t be able to easily implement your intervention then it isn’t a good intervention. That’s true crucially even if you have a few teachers who somehow manage to get it to work and achieve brilliant results.
There are a couple of further complications. What happens if instead of giving everyone 1 hour of training on retrieval practice, I give them lots of training plus observations and targeted feedback plus time to think and act on that feedback? How does that change things?
Simply, doing stuff like that shifts the curve. It moves every teacher in your population a bit to the right. It makes all of your teachers more able to improve student learning as shown in the dotted curve:

What that means is that if I put my little line where it was before, my curve has shifted so much that significantly more of my teachers can get this right – even if they aren’t super teachers!

Without that CPD, only a few teachers can get it right. With the CPD, tons of them can get it right. You should then, of course, ask how easy it is to give that CPD because within the population of CPD providers (be they in school or external) there will be a normal distribution of “ability to shift teacher curves to the right.” You get the point by now.
There are other ways to shift that curve too. Changing your school demographic might be one. Different demographics are more or less likely to respond to certain interventions. It could be that some teachers really struggle in certain schools but do fine in others. That might be because some demographics are “easier” than others.
Remember I didn’t say that we are discussing “teacher quality” – I said that we are discussing “teacher ability to improve student learning.” A component of that will be their training, experience, knowledge etc. But another component will be the context which they are in.
To take some further simple examples, I don’t doubt that it’s possible for teachers to do discovery-based learning or whatever really well. I don’t doubt it’s possible that there are some teachers who use group work to secure incredible outcomes. The same applies to extended projects, competition in class or whatever. But these things are really hard to get right. If you took 100 teachers off the street and asked them to do it, 97 of them would mess it up, with students learning little at best, and going backwards at worst. The converse is true as well. I’ve seen explicit instruction done really badly, with bored students forced to learn things by rote with no understanding. But my experience of that is the minority. In most classrooms I’ve been into where the teacher is doing explicit instruction there’s a liveliness, dynamism, atmosphere of productivity and a long term love of subject being fostered. In my experience, it’s easier to get right.
What I’m trying to say is this: if someone is trying to sell you a new idea or teaching tool or intervention or whatever – ask not “what is the impact of this?” but “how likely am I to screw it up?” If it’s going to be difficult to implement, it might not be worth it. Something with a smaller impact but a much higher likelihood of teachers getting it right may be significantly more worth your while. Blogs, research papers and toolkits should all come with this kind of information; I’m fed up of reading papers which trialled an intervention that showed no impact and say “the problem is with the implementation” – no! The problem is with your intervention. Go away and design an intervention that’s easier to implement – that more teachers will get right more of the time.
I once read a peer-reviewed article about a particular scheme of work that someone implemented in school and showed no impact. In the conclusion they said this was because the scheme was designed for 65 minute lessons and the school in question had 55 minute lessons. I say it again: if your scheme of work relies on 65 minute lessons to work it isn’t a good scheme of work because a hell of a lot of people won’t be able to get it to work. Sure, there might be a super teacher out there who can squeeze those 65 minutes into 55, but for most of us, that isn’t going to fly.
You made it this far. I hope going through the chemistry was worth it. And I’ll leave you by saying it one more time for luck: if your intervention is hard to implement, it’s not a good intervention.
*This is obviously a massive over-simplification and I have taken many terminological and conceptual liberties. Please do not attempt to pass A-Level Chemistry.

February 21, 2020 at 12:38 am
Hi! Love this piece!
I wonder why only those particles with particular minimum velocity will bond?
LikeLike
February 21, 2020 at 6:45 am
Google activation energy 🙂
LikeLiked by 1 person
February 21, 2020 at 7:41 am
As soon as you drew your first Excel distribution curve while talking atoms, I knew you were going there with Maxwell-Boltzmann. Excellent article as well, and a lot to think about.
LikeLiked by 1 person